XRP is currently hovering between $1.36 and $1.65, with critical support around $1.36–$1.40 and dominant resistance near $1.65. Traders are watching to see if XRP can hold its lower floor and break above to fuel the next move up. Conversely, dropping through these levels may open a downtrend toward the next support. That’s the core of the current setup.
Market Snapshot: Support Zones Anchoring XRP
XRP’s price recently bounced from around $1.36–$1.38, a key support cluster defined by Fibonacci retracement levels and volume profile strength. Analysts highlight this range as essential; a failure here could target $1.30–$1.32 next, and even deeper toward $1.20–$1.22 if momentum deteriorates .
Additionally, classical pivot-point analysis points to nearby supports at $1.34, $1.31, and the strongest at $1.27, suggesting layered defense zones below current levels .
Resistance Barriers: Overhead Hurdles to Watch
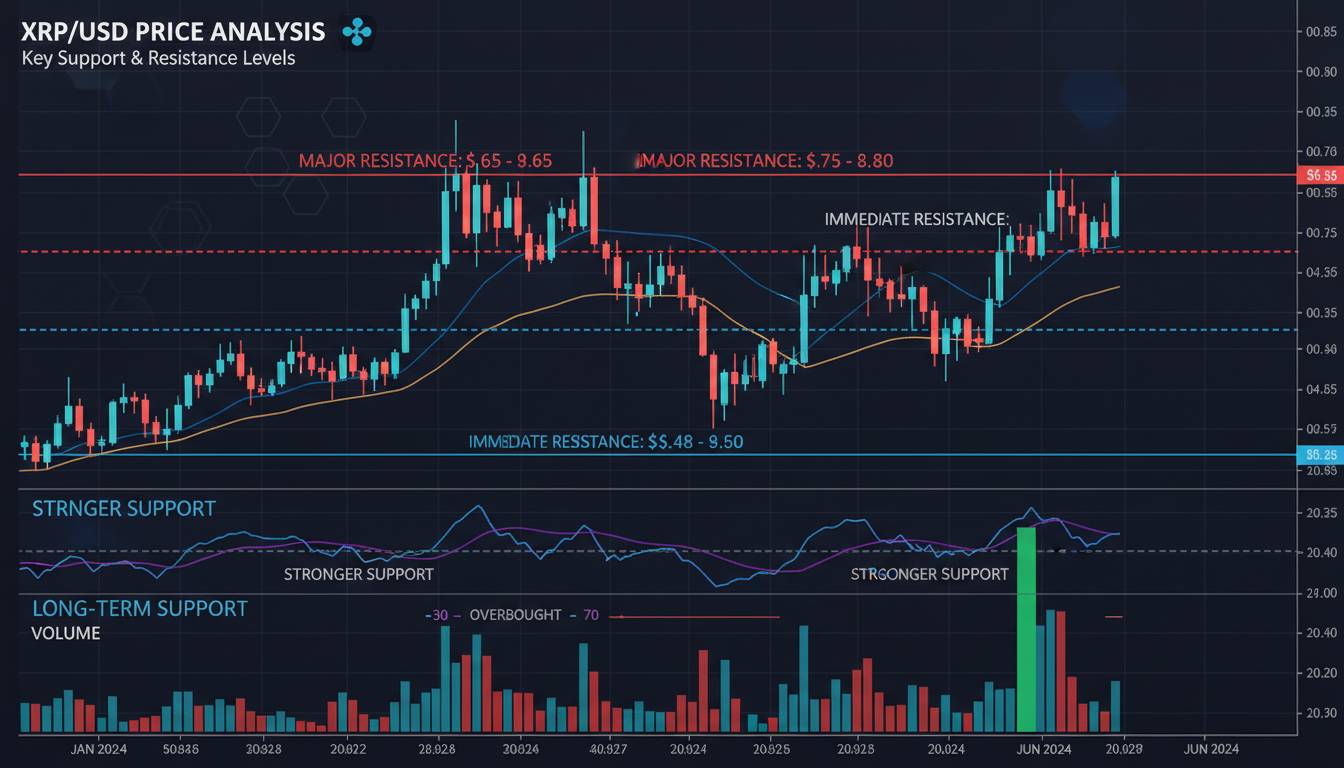
On the upside, $1.65 stands as a major resistance level—XRP has tested this barrier on multiple occasions and failed to breach it . It correlates with the 20-day EMA and recent swing high, reflecting a zone where selling pressure intensifies.
Beyond that, broader resistance clusters form around $1.75–$1.80, aligned with the 50-day EMA and chart patterns like triangles . These levels often cap rallies and require strong volume to overcome.
Sentiment and Technical Indicators: Gauging Momentum
Current indicators show XRP in oversold territory. The RSI sits near 18–25, signaling extreme oversold conditions that historically coincide with powerful reversals . On top of that, open interest (OI) in futures markets has collapsed roughly 43%, suggesting reduced leverage and less aggressive positioning—conditions ripe for a reversal if buying interest returns .
Moreover, whale wallets—those holding more than 1,000 XRP—are reportedly accumulating during dips, adding a supportive narrative to the data .
What Traders Are Watching Next
Traders and analysts are eyeing three scenarios:
- Bullish Breakout: A break above $1.65–$1.75 with volume could flip the trend and nod toward the next resistance near $2.00.
- Rangebound Consolidation: XRP may trade sideways between $1.40 and $1.65 in the short term if market sentiment remains cautious.
- Deeper Correction: A breakdown below $1.36 may push the price to $1.30–$1.32, and if that fails, toward the $1.20 area .
“The RSI’s position in the lower teens marks an oversold condition that historically precedes a rebound, especially when volume contracts and accumulation in on-chain wallets increases.”
Quick Take for Traders
- Entry zone: Watch for price action near $1.36–$1.38; a confirmed bounce could be an attractive long entry.
- Targets: Success above this support may push XRP toward $1.65–$1.75, with broader breakout potential above $2 if momentum builds.
- Caution point: Failure to hold $1.36 increases chances of deeper drops toward $1.30–$1.20.
Conclusion
XRP is navigating a delicate technical landscape. Support near $1.36–$1.40 is critical for stability, while $1.65–$1.75 forms the immediate overhead resistance zone. Extreme oversold RSI readings, accompanied by declining futures volume and accumulation by larger holders, suggest a potential swing one way or the other. Traders should be vigilant around these floors and ceilings, using clear entries, exits, and stop-loss levels based on price confirmation rather than guesswork.
FAQs
What is the key support level for XRP right now?
The main support zone is around $1.36–$1.40, with potential secondary support at $1.30–$1.32 if that breaks.
Where’s the immediate resistance that XRP needs to watch?
Immediate resistance lies at $1.65, followed by a higher cluster at $1.75–$1.80.
Is XRP oversold?
Yes—RSI levels between 18–25 indicate extreme oversold conditions, often signaling a potential reversal.
How much could XRP drop if support fails?
If $1.36 fails, next downside levels include $1.30–$1.32, and possibly a deeper test at $1.20.
What’s needed for a bullish move above resistance?
Traders should look for a break above $1.65–$1.75 with volume confirmation to signal bullish strength.
Are big wallets accumulating XRP currently?
Yes—data shows wallets holding more than 1,000 XRP are adding on dips, indicating moderate accumulation interest.