
More in News
-

News
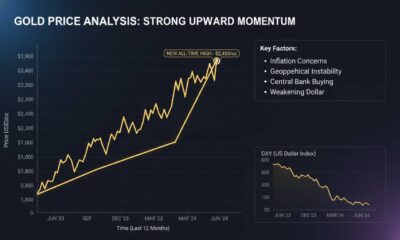
Gold Price Analysis: Crypto Decoupling From Safe-Haven Trends
Explore Gold Price Analysis and crypto decoupling from safe-haven trends. Get clear market insights, key signals,...
-
News
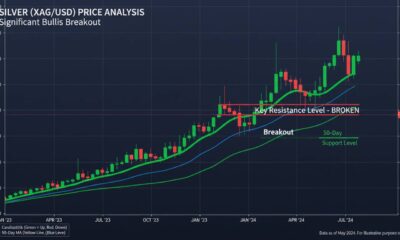
Silver Price Analysis: XAG to XAU Ratio Drops Amid Selloff
Analyze silver price action as the XAG to XAU ratio drops amid a broader metals selloff....
-
News
Trump Crypto Ventures to Benefit From SEC? Shocking Impact
Discover how Trump Crypto Ventures to Benefit From SEC? could reshape regulations, markets, and investor confidence....
-
News
BNB Price Prediction: Monthly Targets and Key Resistance
BNB Price Prediction: Monthly Target Challenges Resistance as BNB tests $660. See key resistance levels, market...
-
News
Bitcoin Price Prediction: Why BTC Lags Despite War De-escalation
Explore Bitcoin Price Prediction as war de-escalates and BTC keeps underperforming. Get key insights, market drivers,...
-
News
Gold Price Free-Falling: What It Means for Investors
Gold price free-falling signals a major market shift for US investors. Discover risks, opportunities, and smart...
-
News
Silver Price Prediction: XAG/USD Holds $68 as Fed Stays Hawkish
Silver Price Prediction: XAG/USD Holds $68 amid a hawkish Fed outlook. Get key silver market insights,...
-
News
Monero Price Prediction: XMR Eyes Breakout as Supply Tightens
Monero Price Prediction: XMR trapped below $180 as exchange liquidity dries up. Explore breakout signals, supply...
-
News
BTC USD Price Nears $72,000 as Tensions Ease, Shorts Burn
BTC USD price runs toward $72,000 as Middle East tensions cools, triggering $160M in shorts liquidated....
-
News
Will Bitcoin Reach 100000? Expert Predictions & Key Signals
Will bitcoin reach 100000? Explore expert predictions, market signals, and key trends shaping BTC price moves....
-
News
XRP Price Prediction: Is a Bottom In Before the Breakout?
Explore XRP price prediction with on-chain data signaling a potential bottom. See key breakout indicators, market...
-
News
Bitcoin Bullish Prediction: Signals Pointing Higher
Explore bitcoin bullish prediction signals pointing higher. See key indicators, market trends, and what they could...
-
News
Bitcoin Long Term Prediction: Expert Forecast & Price Outlook
Get the latest bitcoin long term prediction with expert forecasts, price outlook, and market insights. Explore...
-
News
Will Bitcoin Reach $1 Million? Expert Predictions & Risks
Will bitcoin reach $1 million? Explore expert predictions, key risks, and market factors shaping BTC’s future....
-
News
Is Bitcoin a Good Investment? Risks, Rewards & Smart Insights
Is bitcoin a good investment? Explore risks, rewards, and smart insights for NG investors. Learn key...


Trending


