Solana (SOL) trades at approximately $83.28 as of today, February 27, 2026, reflecting a modest intraday dip of around 4.1% citeturn0finance0. The most pressing development: despite surging on-chain activity and institutional inflows, SOL’s price remains under pressure—raising the question of whether the uptrend can hold or if a correction looms.
Solana’s network dominance is undeniable. In January, it processed $117.7 billion in DEX volume—capturing nearly 35% of the market—and set records in transaction counts and success rates . Its active address count exploded to 27.1 million in mid-January, a 56% weekly surge, with 515 million weekly transactions and $52.4 billion in DEX volume . Real-world asset (RWA) protocols on Solana reached $1.64 billion in TVL by mid-February, with over 285,000 holders—a doubling in 30 days .
Institutional interest is also rising. Spot Solana ETFs have accumulated $2.61 billion worth of SOL—over 5% of total supply—by February 15 . Meanwhile, prediction markets show a major unlock of 625,000 SOL scheduled for February 28, a small fraction (~0.135%) of circulating supply .
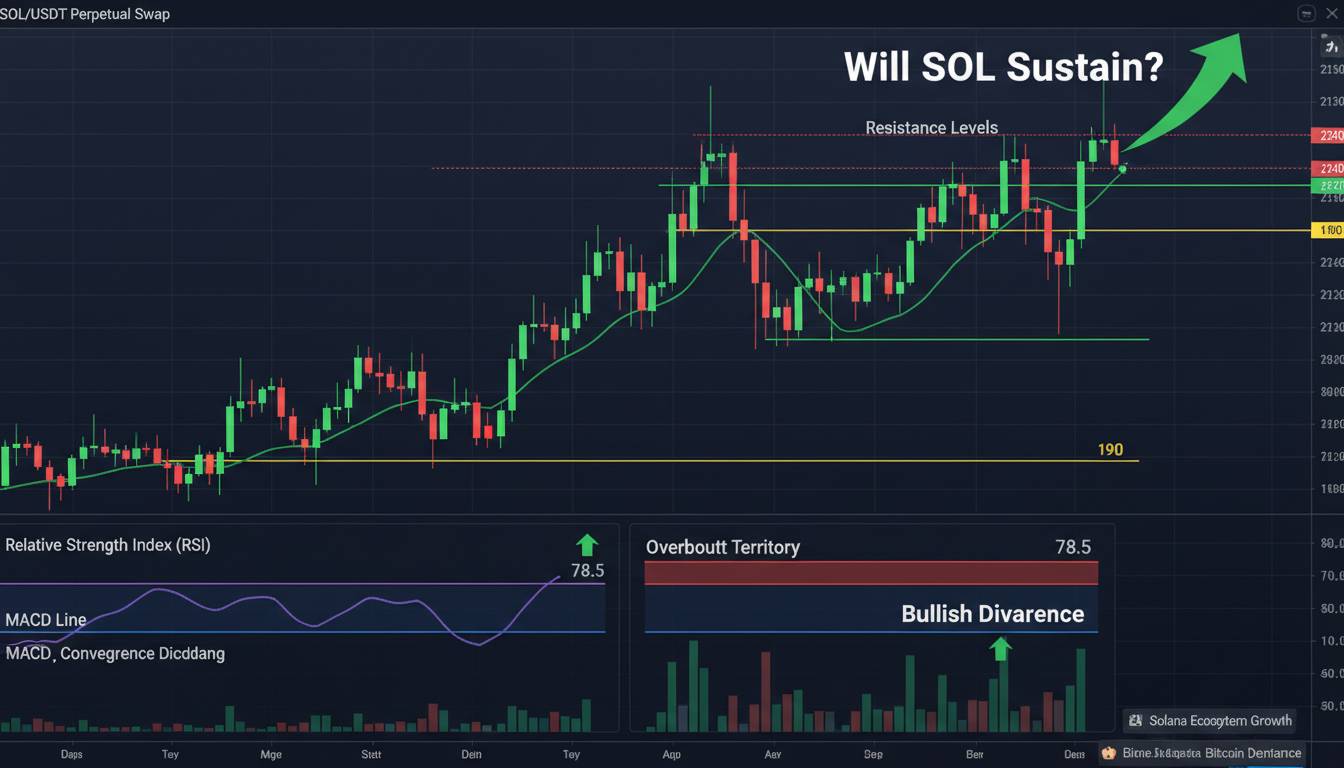
Technical indicators tell a mixed story. A head-and-shoulders pattern has formed, with a neckline around $95 already breached—suggesting potential downside toward $50 if confirmed . SOL remains in a descending channel since September 2025, with lower highs and lows capping rallies . Volume trends reinforce caution: sell-offs have come with higher volume than recoveries, indicating distribution rather than accumulation .
Support and resistance levels are clear. The $88.6–$89.6 zone is a critical resistance; a sustained break above could open the path to $96.9 and beyond . On the downside, failure to reclaim $100 could push SOL back toward $78 .
A recent rebound above $80 was fueled by renewed on-chain activity, but analysts caution that if usage cools or liquidity tightens, gains could evaporate quickly . Long-term holder accumulation is waning, according to the HODLer Net Position Change indicator, signaling eroding confidence among core supporters .
If you’re watching the $88–$90 level, here’s why it matters: a clean break above would validate short-term recovery momentum and could trigger a move toward $95–$100. If SOL fails there, expect a retest of $78 or lower.
What’s next? The February 28 unlock of 625,000 SOL could add supply pressure, though its impact may be muted given its small size . Institutional flows and ETF accumulation remain a tailwind, but long-term holder fatigue may blunt their effect . On-chain metrics—especially RWA growth and developer engagement—are strong, but technical resistance and bearish patterns demand respect.
Markets will watch whether SOL can reclaim and hold above $90. A sustained break could shift sentiment toward recovery. If not, the head-and-shoulders pattern and descending channel suggest deeper correction is possible.
Solana’s fundamentals are robust, but price action is telling a different story. The next few days will be decisive.